
Time-Saving Features Boost Capability, Navigation
In early 2016, when Medius Ag released the first version of Analytics, it provided a modernized way for users to analyze data across multiple parameters using statistical analysis based on Z-scores. That tool has evolved over the years to meet your ever changing needs as a user. Today, that dynamic functionality became even more powerful and flexible through a fundamental redesign that incorporates valuable feedback received from the growing international army of Medius.Re users across more than a dozen different crops. Still utilizing the concept of Z-scores, Analytics allows you to make comparisons across different data fields, locations and years, but now with easier navigation and increased capability.
Z-score analysis empowers a user to simultaneously evaluate multiple varieties and variables across time and space. Imagine having multiple years worth of data across multiple locations simplified down to a simple, customizable score for analysis. That’s the power of Medius.Re Analytics. What is a Z-score? Simply put, a Z-score is the distance–measured in standard deviations–a value is from the mean (average) of a data set. But you don’t need to have a deep understanding of Z-score analysis to use Medius.Re, because we do the heavy lifting for you!
New Look, New Features
At Medius, our mission is to make agricultural data useful to our customers. We are proud to have users of all ages and proficiencies harness the power of .Re to help them simplify and navigate the complexities of modern agriculture. We also strive to give our customers the tools they need and are comfortable with so that they have a positive experience not only analyzing data, but also sharing that data when they need to. With those goals in mind, we undertook an effort to improve some features while adhering to our underlying commitment to accessibility and seamlessness.
Easier Navigation
Familiar features like data fields, filters and trial blocks are now more easily accessible and manageable.
More Capability
In addition to the features you already know and love, a user can now save time with presets and customize how data is grouped, using the new Presets and Data Grouping features.

Get The Most Out of Analytics
The following tutorial will provide you with an opportunity to get the most out of Analytics. Each section will illustrate the usage of the different features available.
Presets
Presets are a fast, convenient new way to get access to the data in the way you need it quickly and easily. When you first enter Analytics, you will be greeted with a popup that will allow you to pick your preferred presets if they are available. Each preset will designate how the data will be grouped, what data fields are selected and what filters are applied. Simply select the preset you need to access your data. Presets are completely optional and if you would like to continue where you previously left off or start your own custom analytics configuration, select the "Custom Analytics" option.

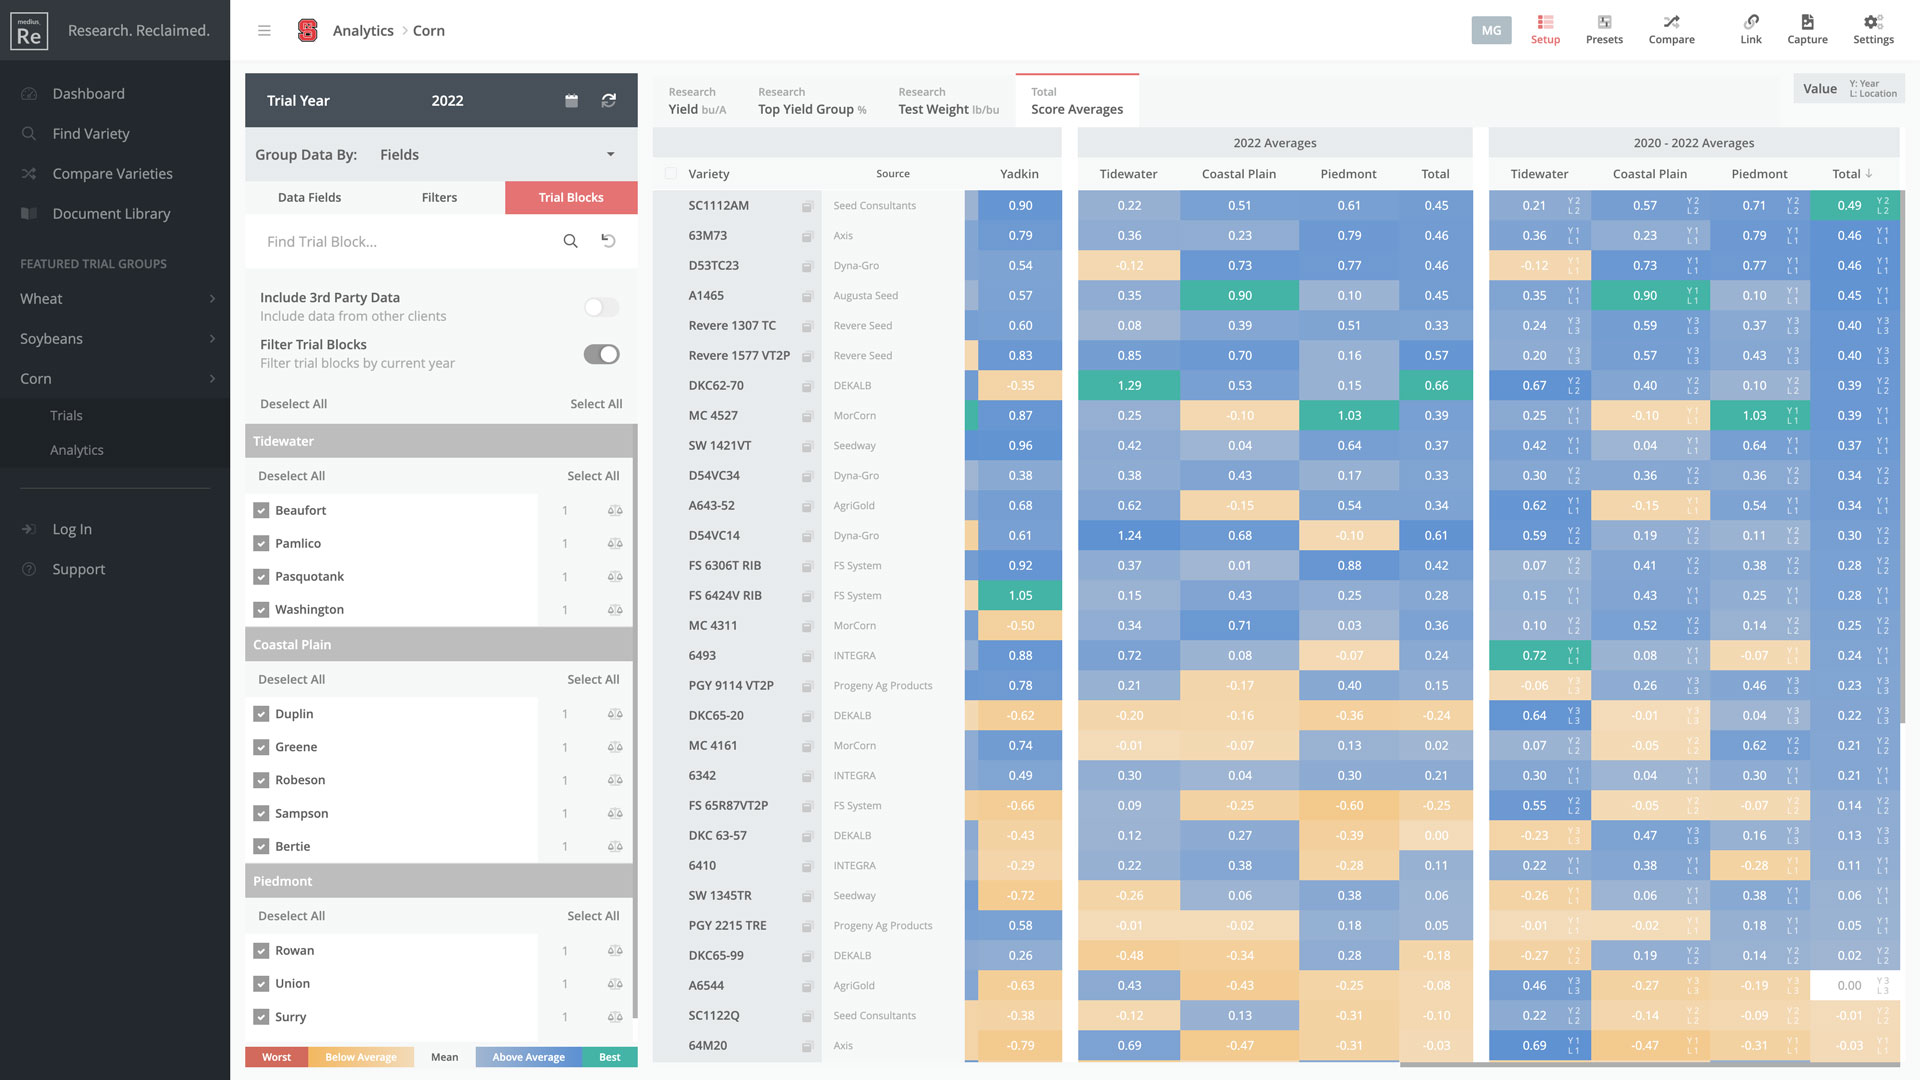
Group Data
By default, data is grouped according to tabs by the data fields that have been selected. In the new version of Analytics, a user can group data by Data Fields, Trial Blocks (locations) or Trial Block Categories (regions). When Data Fields are selected, each tab will be a data field and each column will be trial block or trial block category. When grouping by Trial Blocks, each tab will be a trial block and each column will be a selected data field. The same is true when grouping by Trial Block Categories. This new method of grouping helps replicate a summary table look that many growers are used to seeing and might be particularly useful to university or extension staff during grower meetings and outreach efforts.

Settings
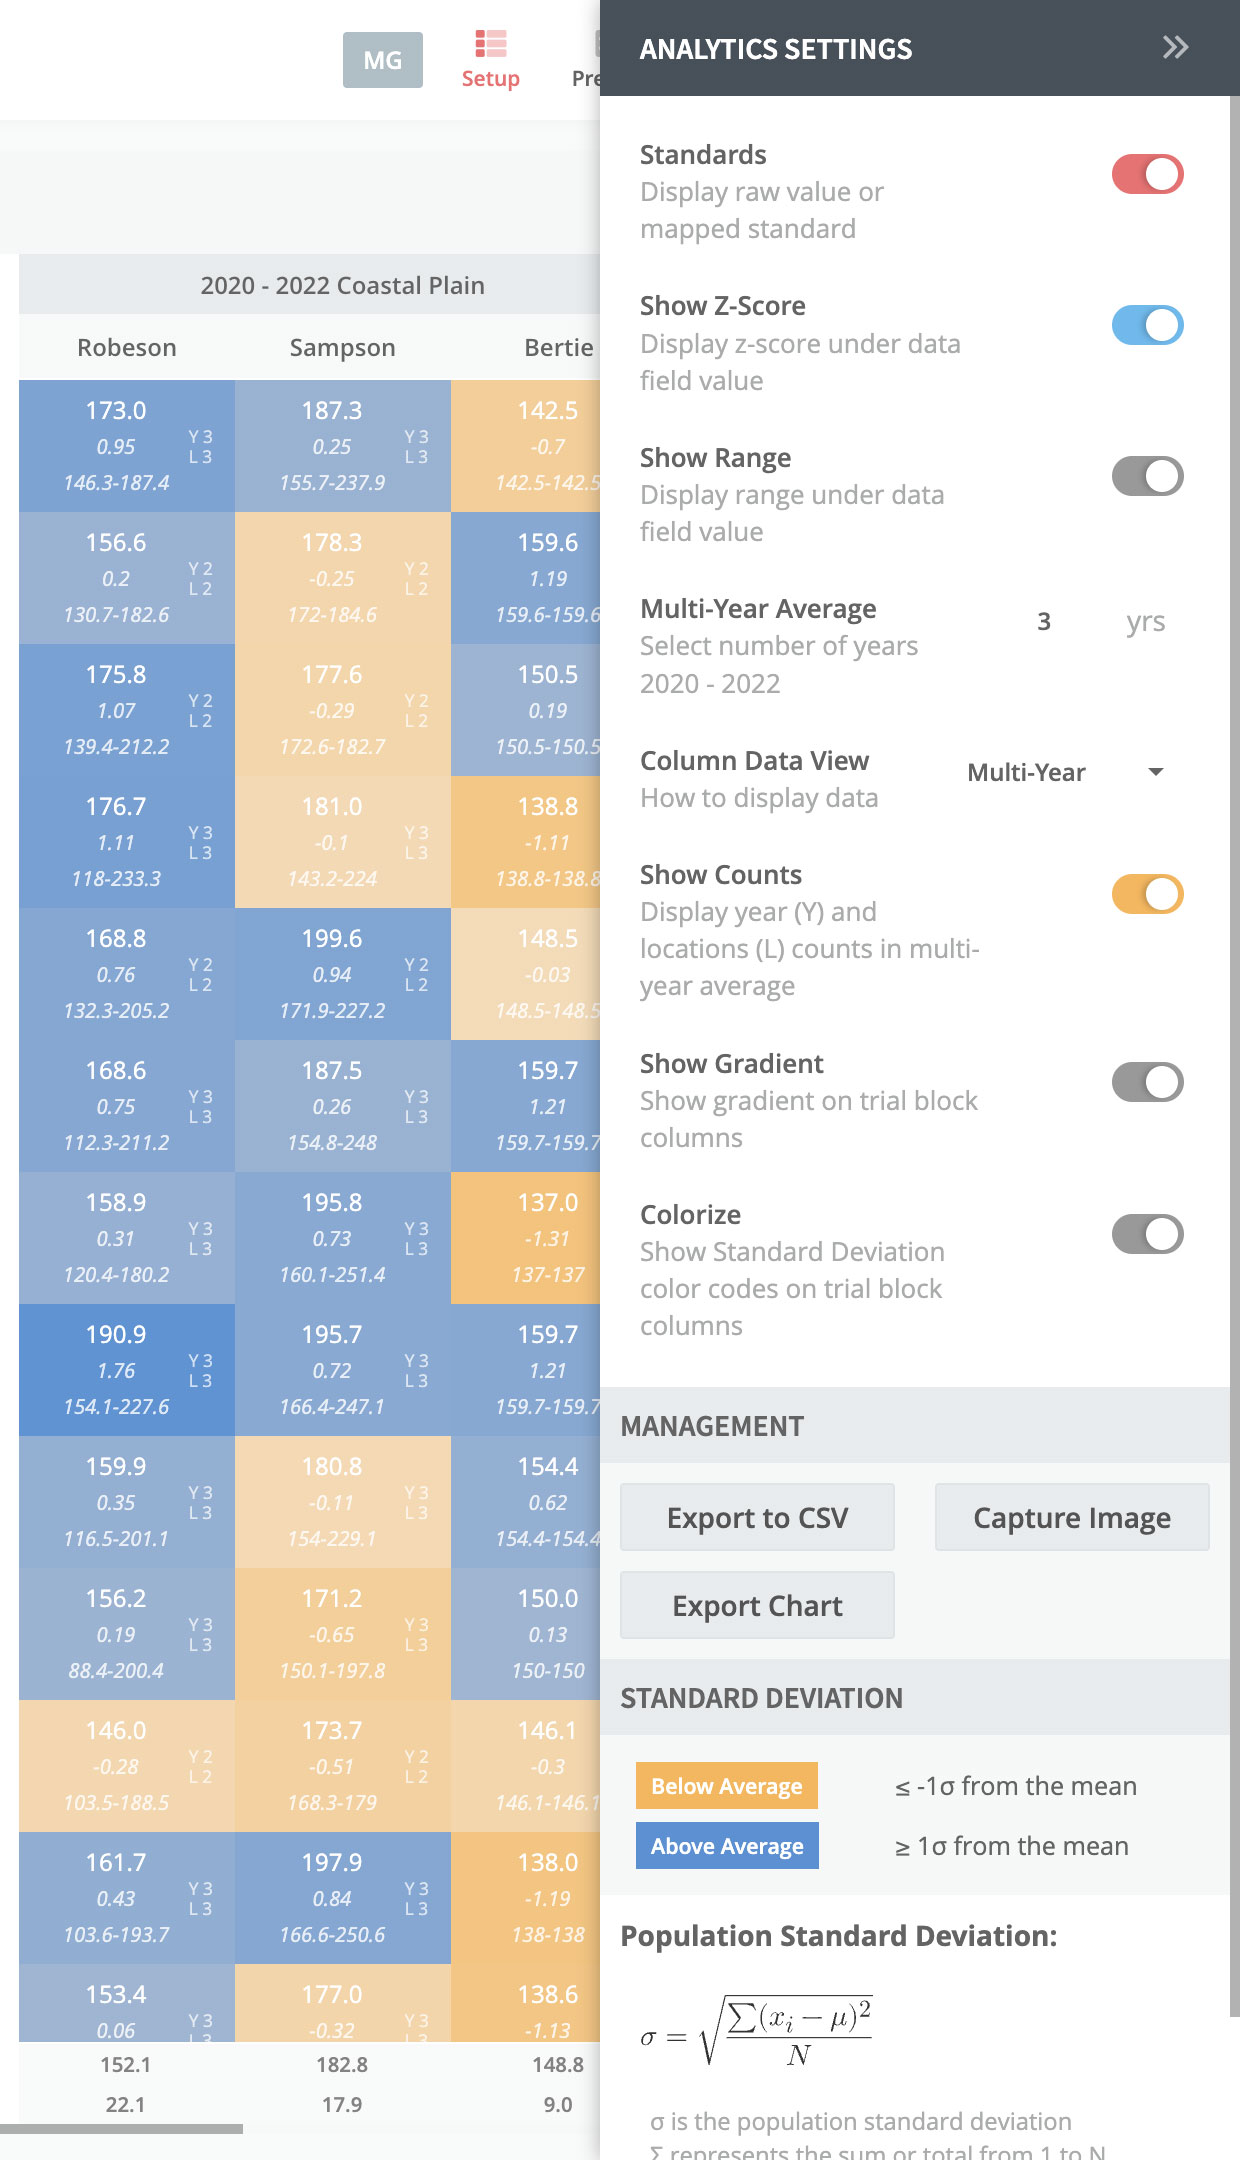
Controlling what data you select is important, but so is managing how you view that data. Analytics Settings allow you to manage your layout and the view of the data you are analyzing. The following options are available in Settings.
Standards
Display raw values or mapped standards
Show Z-Score
Display Z-scores under data values
Show Range
Display range for multi-year data
Multi-Year Average
Select the number of years to display in multi-year summary columns. Typically this value is 2-3 years.
Column Data View
By default, each column, whether it's a trial block or data field will show the currently selected trials years value (Current Year). The columns at the end of the table will have a multi-year average for each group. However, if you select "Multi-Year" the main table columns will display the multi-year average.
Show Counts
Display year (Y) and locations (L) counts for multi-year averages
Show Gradient
The gradient applied to the colorized cells represents the statistical distance above or below the average.
Colorize
Show above or below average designations for each cell. If "Show Gradient" is turned off, colorize will highlight only the cells that are more than 1 standard deviation away from the mean. If "Show Gradient" is turned on it overrides colorize.
Filters
When you want to analyze a specific subset of your data, filters help you easily focus your attention. To apply a filter, select the "Filters" tab, located between "Data Fields" and "Trial Blocks", then make the necessary adjustments. You can filter out specific varieties, by specifying the variety or specific trials accordingly. If you have multiple years selected (see Settings), you have the option of including "All Trial Years" or only a subset of years. For example, if you have 2022 selected as your current Trial Year with multiple years set to 3, you will get data for 2020, 2021 and 2022. However you could narrow that down and only look at data for 2020 and 2022 by selecting those years in filters and ignoring 2021. You can also add multiple filters based on specific values for specified data fields. For example, in the screenshot provided you can see that the data is filtered by "Medium" Maturity Group and certain specified Soil Classifications.

Trial Blocks
The last tab in the Analytics setup pane lets you manage the visible trial blocks. If your license gives you access to other Medius.Re clients you can toggle on 3rd Party Data and view other approved clients' data side-by-side with your data. *3rd party data is only available for clients that have agreed upon data-sharing relationships in place and have designated specific data to be shared with specific clients.
Additionally, you may have more trial blocks available than what were used for the currently selected trial year. If you want to filter trial blocks by only those that were used in the current year turn on "Filter Trial Blocks". Lastly, you can individually select trial blocks, by checking the needed trial blocks in the list.

Total Scores
What are total scores? The total score tab, is the summarization of all Data Fields, Trial Blocks, Trial Block Categories and years into a concise and easy to compare number. This number is calculated from the Z-score performance of each variety in its respective trial across all locations and years.
Weights
After desired data ranges have been selected and filters have been applied, you still might want to make some adjustments to how you analyze your data. One of those ways, is changing the way Z-scores are averaged by adjusting the weight of the data fields and/or the trial blocks. To adjust the weight of a data field, with the "Data Fields" tab selected in setup, click the "scale icon" to toggle weights. Change the value for the data fields you want to adjust. The same can be done for trial blocks, by selecting the "Trial Blocks" tab in setup and adjusting the weights of the appropriate blocks.

Compare
Once you've got your data analyzed, the next step is to select a few of your favorite varieties. Simply click on a row to select the variety (you'll see a checkmark appear to the left of the variety). After selecting the varieties you need, click on "Compare". This will provide you with a side-by-side comparison of the selected varieties with additional supporting data related to the varieties.
