Updated Features Boost Compatibility, Simplified
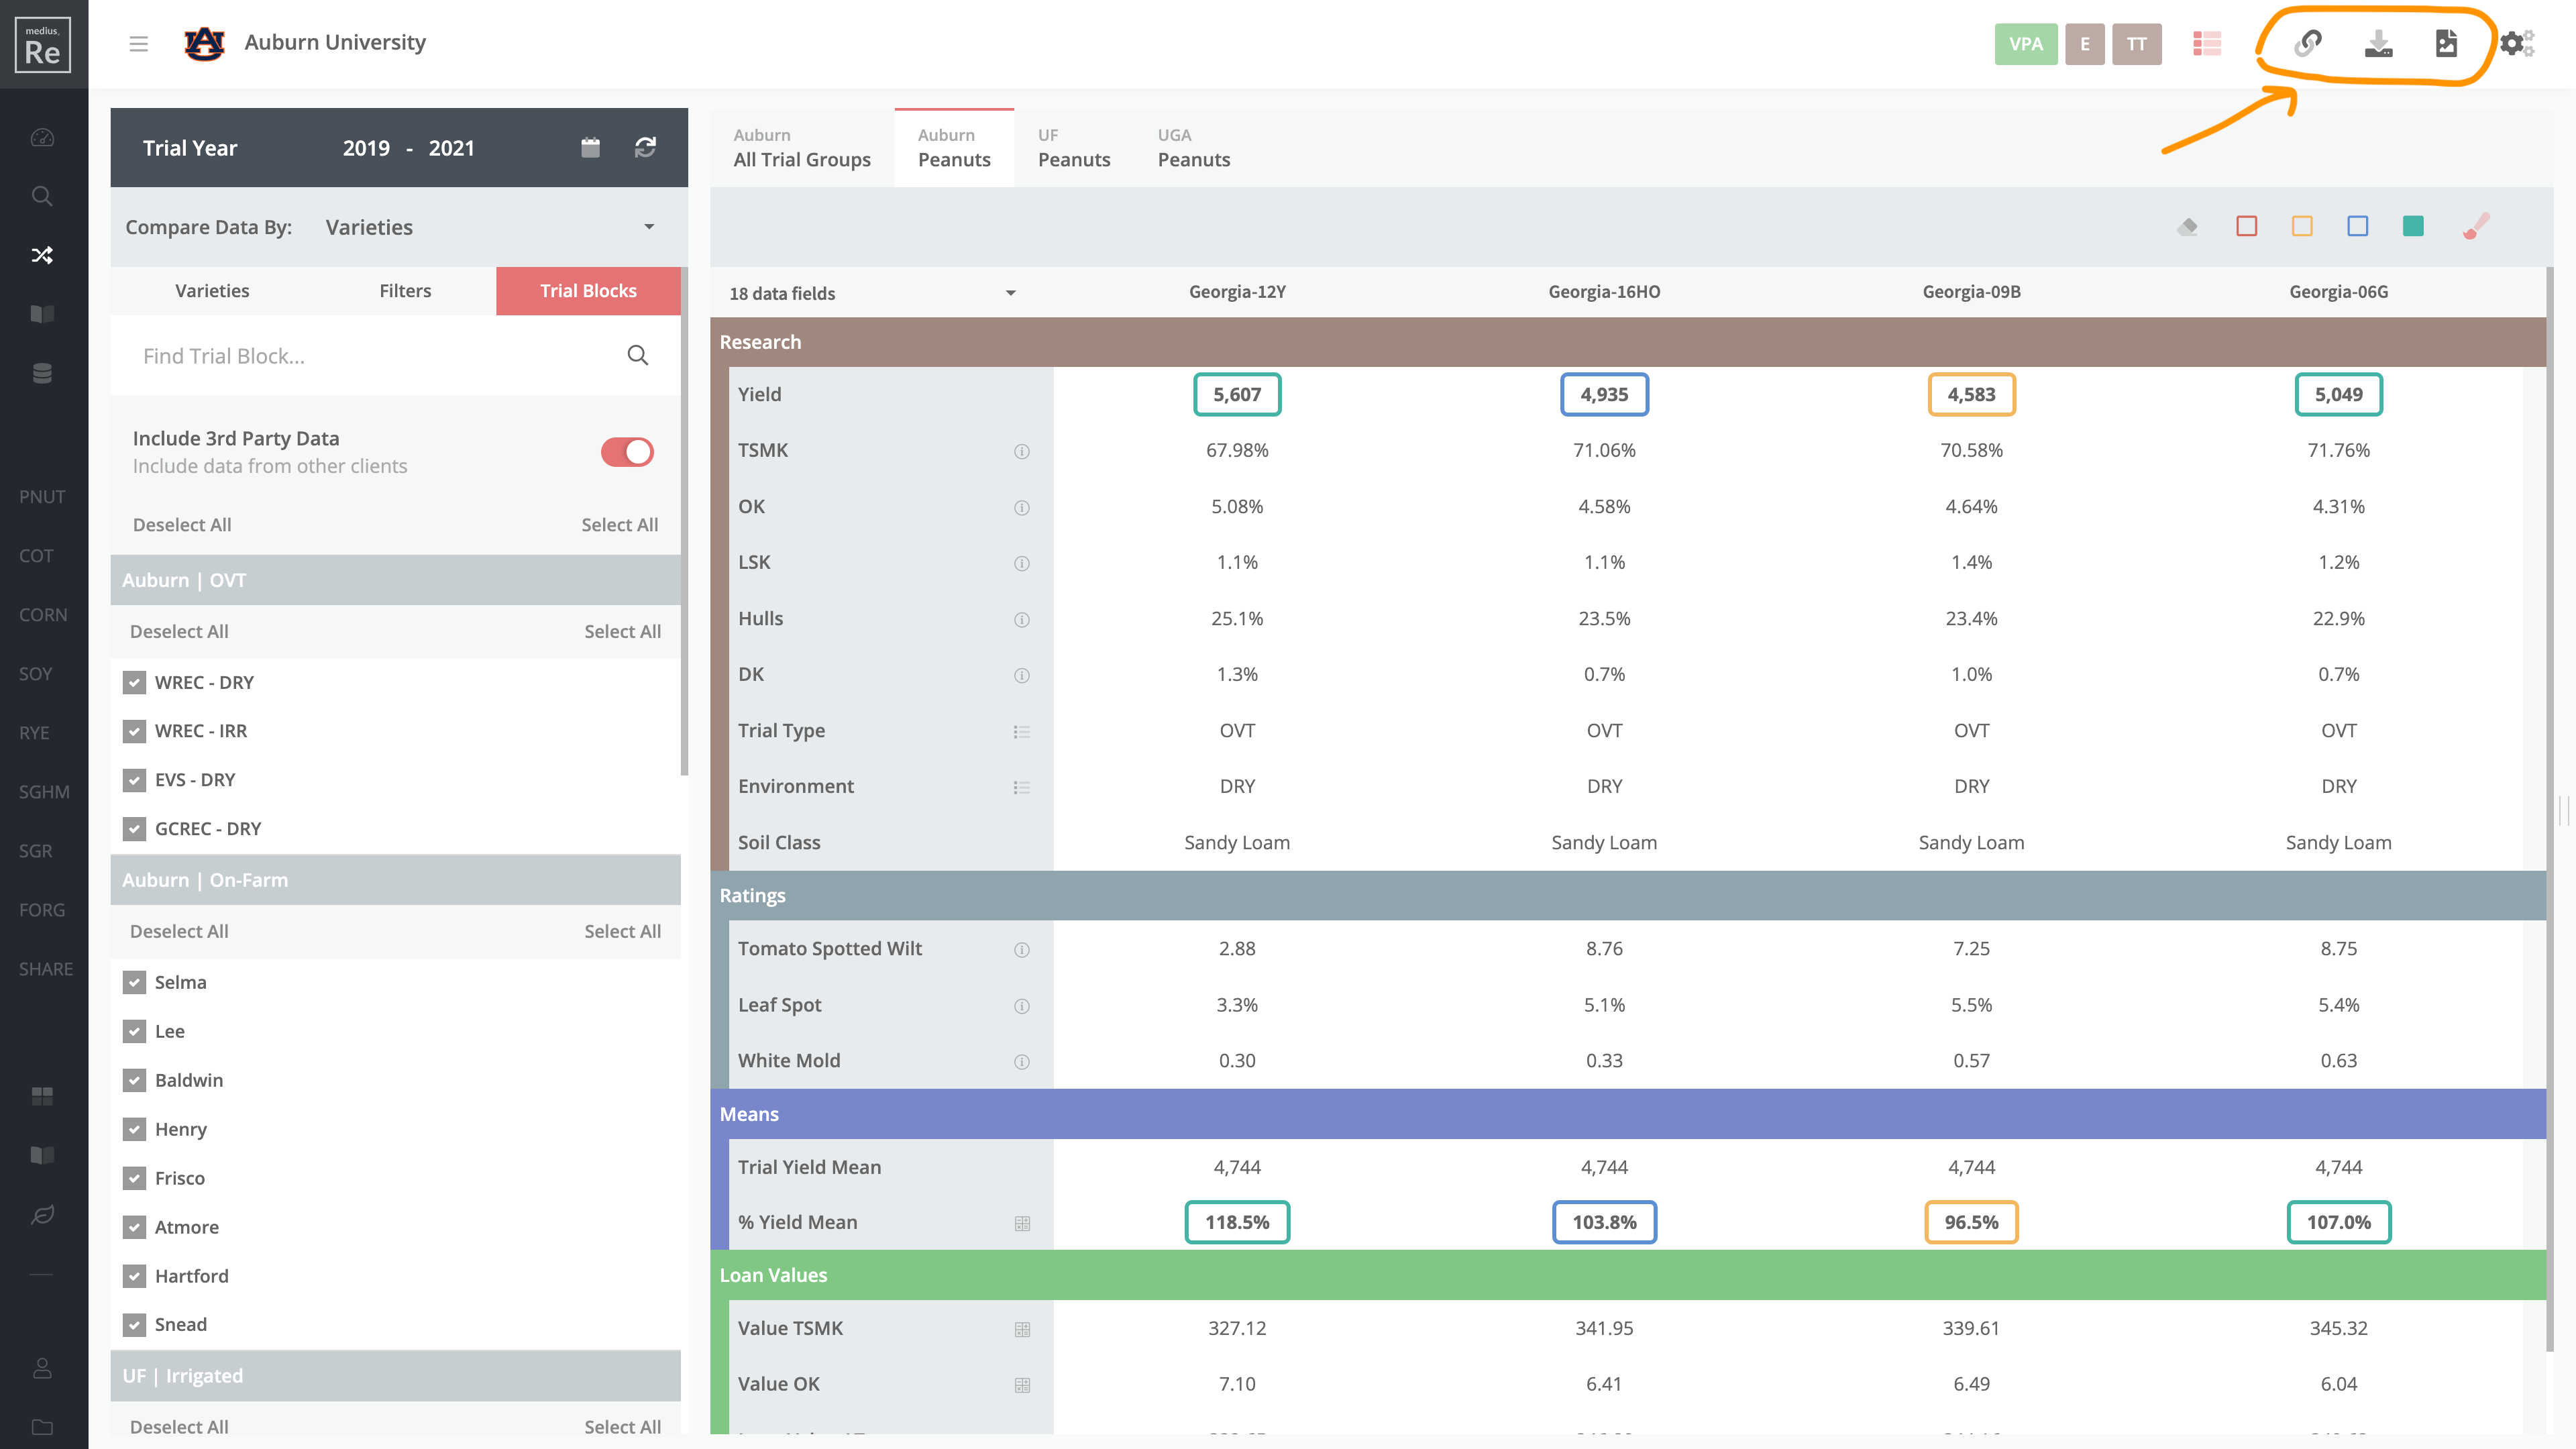
After our last major update to Analytics, we’ve introduced some minor changes to the compare module to compliment the previous changes. We have some exciting new changes coming in our development pipeline and this is the next incremental step to get us there. One of the major structural changes to compare is how you select a Trial Group to view its associated data. In the past there was a nested list of trial groups that could cause confusion as the list grew. To simplify the selection and keep Compare consistent with the design structure of Analytics, trial groups are now accessible in simple tabs.
Understand Comparison
The following tutorial will provide you with an opportunity to get the most out of Compare. Each section will illustrate the usage of the different features available.
Add Varieties
Comparison allows you look at multiple varieties side-by-side. To add varieties, start typing the name of the variety, then select the variety you want to add. In the variety list, if available, in addition to the name you'll see the source and the years of data available. To remove a variety from the list, just click on the "X". Varieties can be reordered by simply clicking, holding and dragging the variety to a new spot.
After adding the desired varieties to your list, you can select the trial years that you would like to compare. For example, in the screenshot provided, 2019-2021 are selected. Simply click on the values or the calendar icon and adjust as necessary.
Compare Data By has been added to prepare for a new feature coming at a later date. Currently in compare you can build a list of varieties, but coming in the near feature will be the ability to compare by treatments.

Filters
When you want to compare a specific subset of your data, filters help you easily focus your attention. To apply a filter, select the "Filters" tab, located between "Varieties" and "Trial Blocks", then make the necessary adjustments. You can compare only data where all selected varieties existed in the same trials by turning on "Correlated Data". If you have multiple years selected, you have the option of including "All Trial Years" or only a subset of years. For example, if you have 2019-2021 selected as your Trial Years, you will get data for 2019, 2020 and 2021. However, you could narrow that down and only look at data for 2019 and 2021 by selecting those years in filters and ignoring 2020. You can also add multiple filters based on specific values for specified data fields. For example, in the screenshot provided you can see that the data is filtered by a "DRY" Environment where Value Per Acre is greater than 600$/acre at "OVT" Trials.

Trial Blocks
The last tab in the Compare setup pane lets you manage the visible trial blocks. If your license gives you access to other Medius.Re clients you can toggle on 3rd Party Data and view other approved clients' data side-by-side with your data. *3rd party data is only available for clients that have agreed upon data-sharing relationships in place and have designated specific data to be shared with specific clients.
By checking the box next to a trial block, that controls what data is visible in the aggregated data under each variety.

Painting / Markup
There is more to just analyzing and comparing data than looking at it for yourself. It's meant to be shared. The paint tool in Compare allows you to mark up your data for better visualization and communication. Simply click on the paint brush in the table header and select your desired color. Once you have a color selected, click on a value in the table and it will be outlined or highlighted for you. If you want to clear an individual value, just click it again. To clear all of the marked values, click the eraser icon to the left of the paint colors. Any values that you have marked will be visible when you share the link or export to a PNG.
Settings
Controlling what data you select is important, but so is managing how you view that data. Compare Settings allow you to manage your layout and the view of the data you are comparing. The following options are available in Settings.
Correlated Data
Display raw values or mapped standards
Standards
Display Z-scores under data values
Hide Empty Fields
Display range for multi-year data
Show Counts
Select the number of years to display in multi-year summary columns. Typically this value is 2-3 years.
Average Group
By default, each column, whether it's a trial block or data field will show the currently selected trials years value (Current Year). The columns at the end of the table will have a multi-year average for each group. However, if you select "Multi-Year" the main table columns will display the multi-year average.
Variety Media
Display year (Y) and locations (L) counts for multi-year averages
Data Field Groups
Toggles coloring the group header
Show Table Header
Toggles the table header
Highlight Selected Cells
Turn this on to highlight the cell instead of border
Add Table Stripes
Shades every other row
Selected Dark Text
If "highlight selected cells" is turned on, this changes the text to be dark instead of light in the highlights

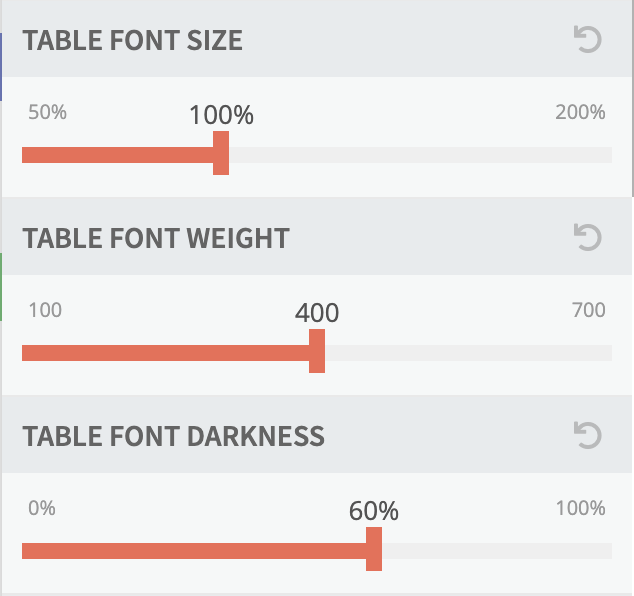
More Settings - Fonts
Depending on your needs for displaying data from compare you may want to make some adjustments to the visibility of the fonts. You have the following adjustments available.
Table Font Size
Adjust the size of the text in the compare table
Table Font Weight
The higher the number the bolder the text will be
Table Font Darkness
The percentages is a ratio of black, where 100% is pure black and 0% is pure white
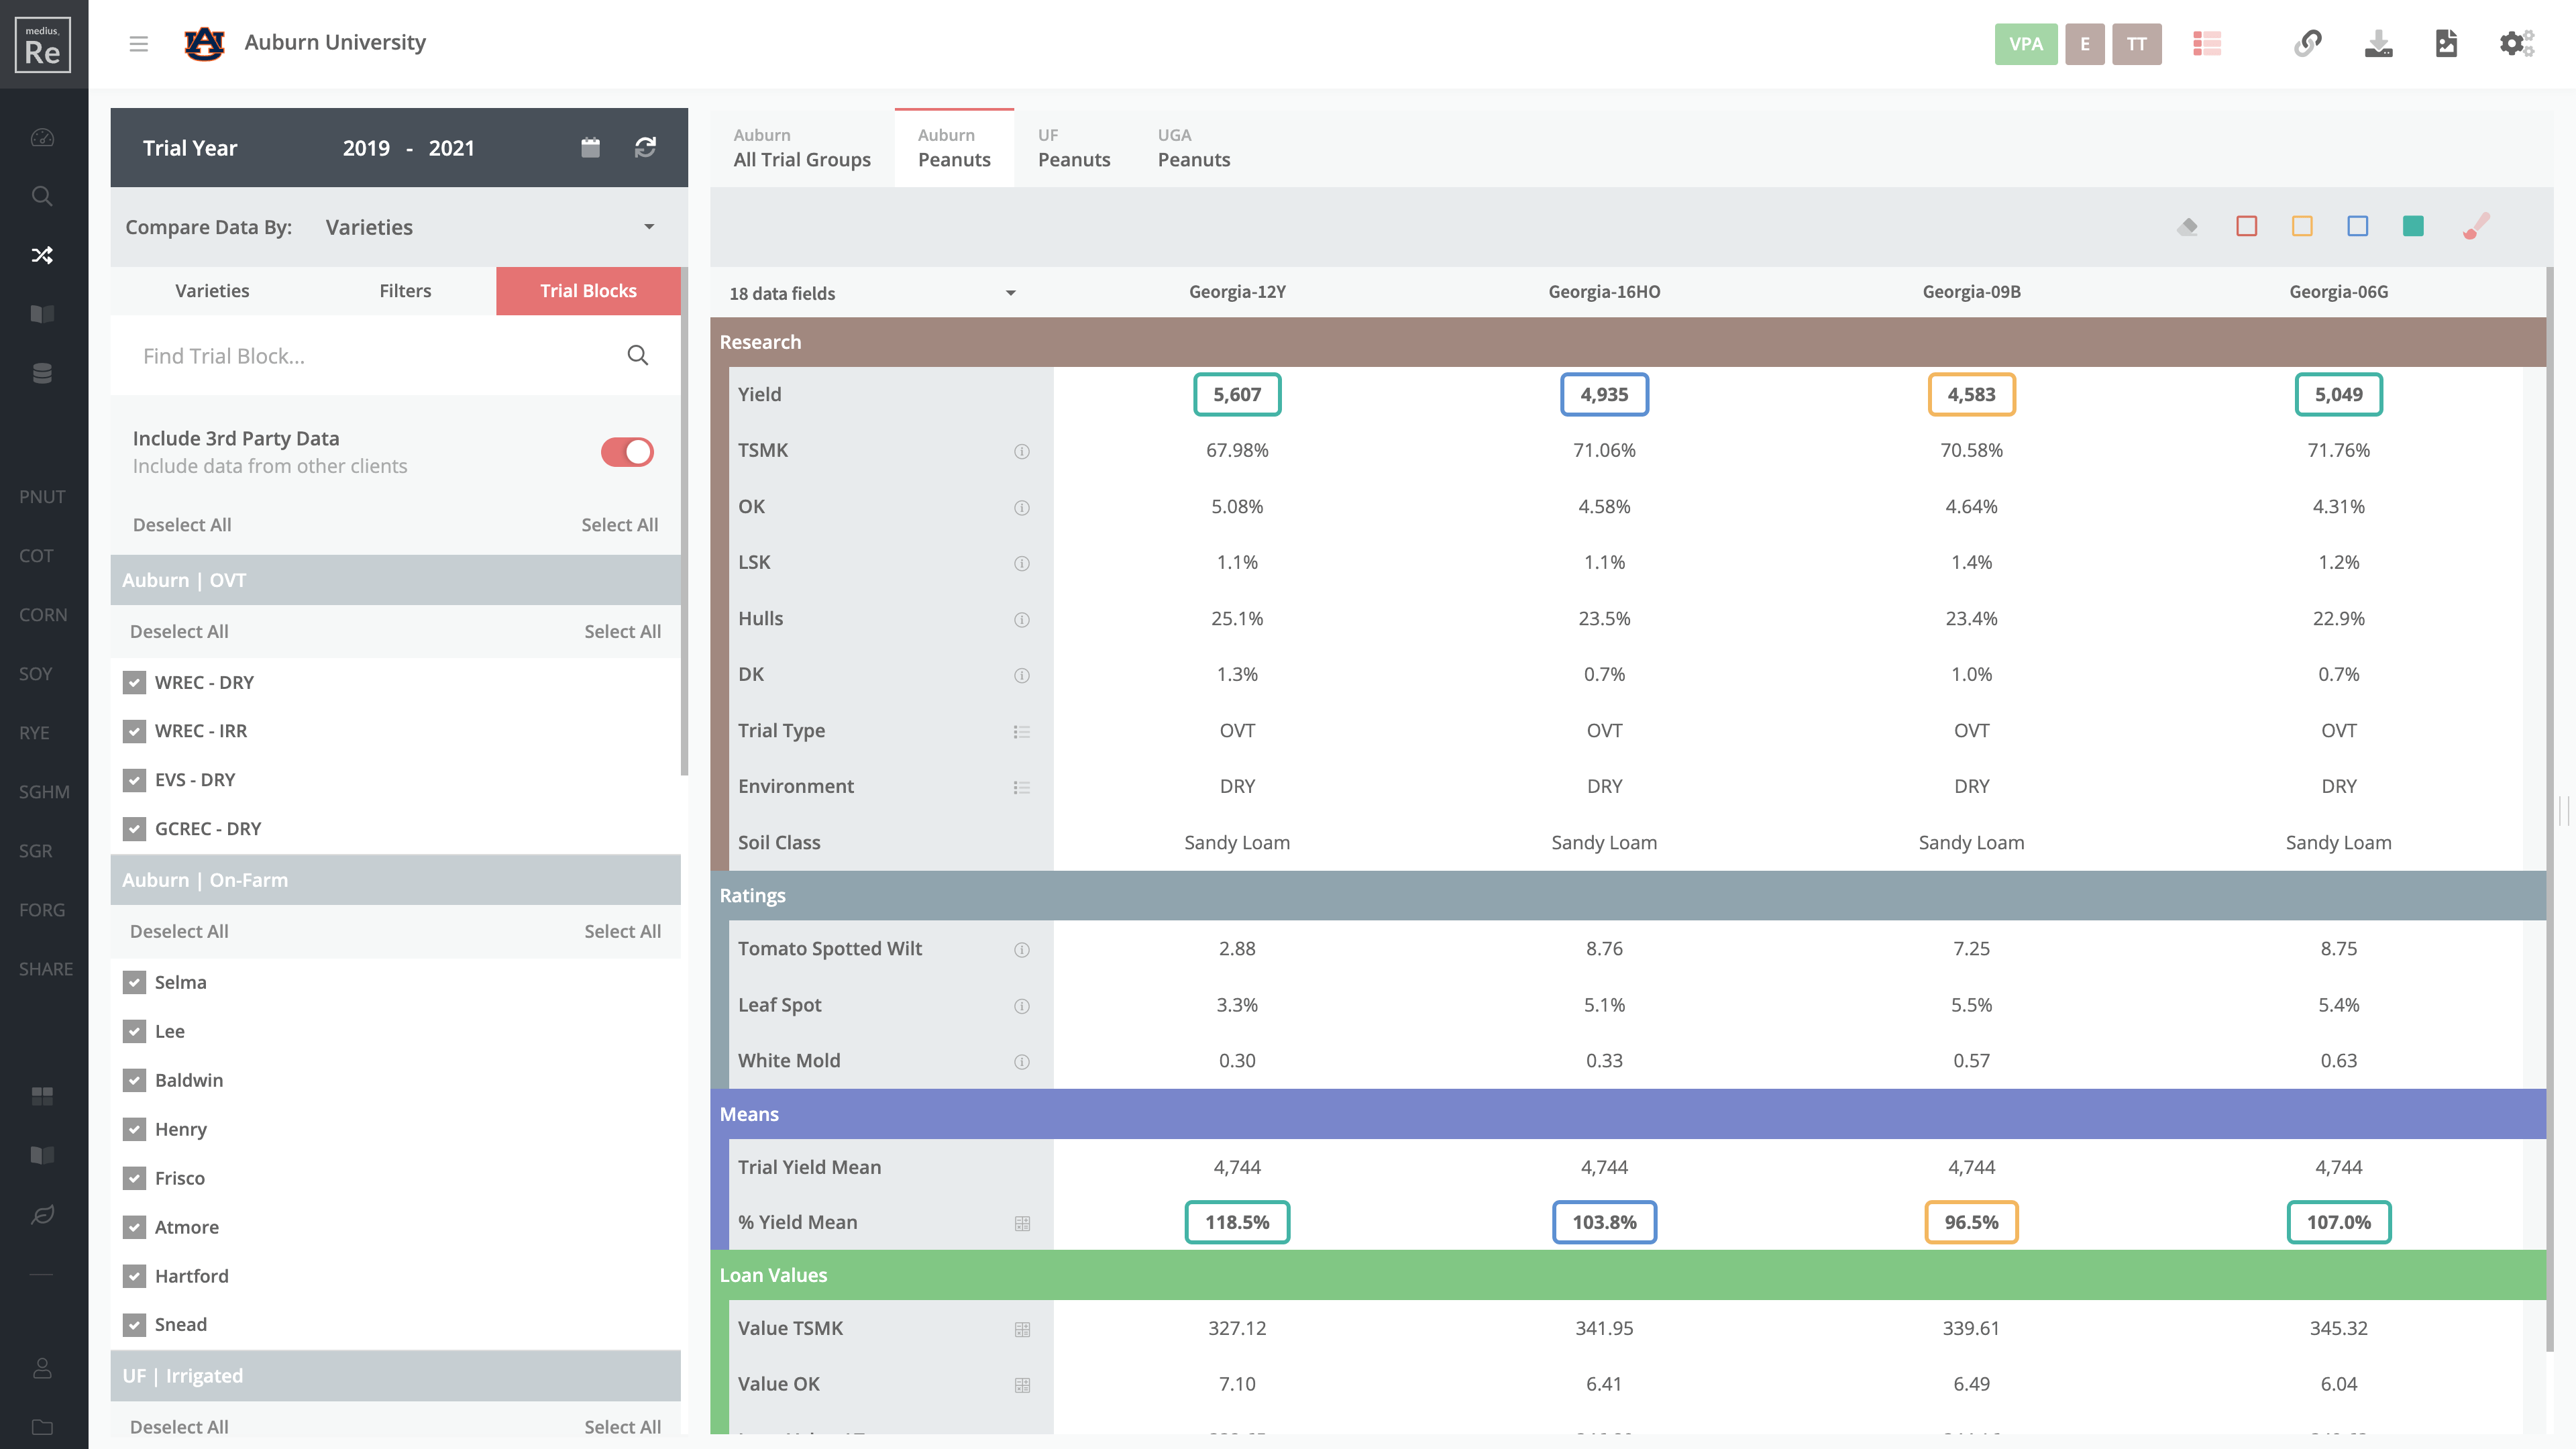
Share
Once you've got your data comparison set how you like it, the next step is to share it. There are three ways to share your comparisons. First, you can generate a unique link by clicking the link icon in the top header. This will produce a unique link that can be shared through text or a QR code. Second, you can download the data in Excel. The Excel sheet generated will have the comparison table as well as all of the underlying support data that makes up the aggregate values. Lastly, you can export the table as an image by clicking on the image icon located in the header.